
Quantitative Risk Analysis: Let The Numbers Do All The Talking
How do you convince your boss to spend $50,000 on a new firewall? By showing them it'll save $100,000 in losses. People understand money, not long technical documents.

Here’s something you should know about cybersecurity:
We talk about risks all the time. “High risk.” “Medium priority.” “Critical vulnerability.”
But what does that actually mean?
If I say a server has a “high risk” of being breached, does that mean we should spend $10,000 protecting it? $100,000? A million?
Nobody knows, because we’re using feelings instead of numbers.
Welcome to the problem quantitative risk analysis solves. And if you’re studying for the CISSP exam, buckle up, because Domain 1 loves testing this stuff.
What can you expect from this article:
Difference between Qualitative and Quantitative analysis
High-level overview of the Quantitative analysis process
Explanation of important terms and formulas you need to perform Quantitative analysis
Performed analysis on a real-world scenario
CISSP exam tips and tricks for this topic
Preparing for the CISSP exam?
Check out my free materials to help you prepare efficiently!

Qualitative vs. Quantitative: Feelings vs. Facts
First of all, we should establish the difference between Qualitative and Quantitative analysis.
I won’t get into much detail this time, but you need to understand the main difference between them.
Qualitative analysis uses scoring systems like Low/Medium/High or 1-5 scales.
It’s mainly opinion-based. Two different analysts might rate the same risk completely differently.
Quantitative analysis?
It assigns actual dollar values to everything.
I know what you’re thinking, why would we even use Qualitative analysis when it seems less accurate?
That’s a story for another time.
What you need to know here is that one isn’t better than the other. Each one is more convenient in different situations.
The Eight-Step Process to Assess Risks
First of all, let’s take a look at the whole process from a high level to give you that basic understanding of what is going on.
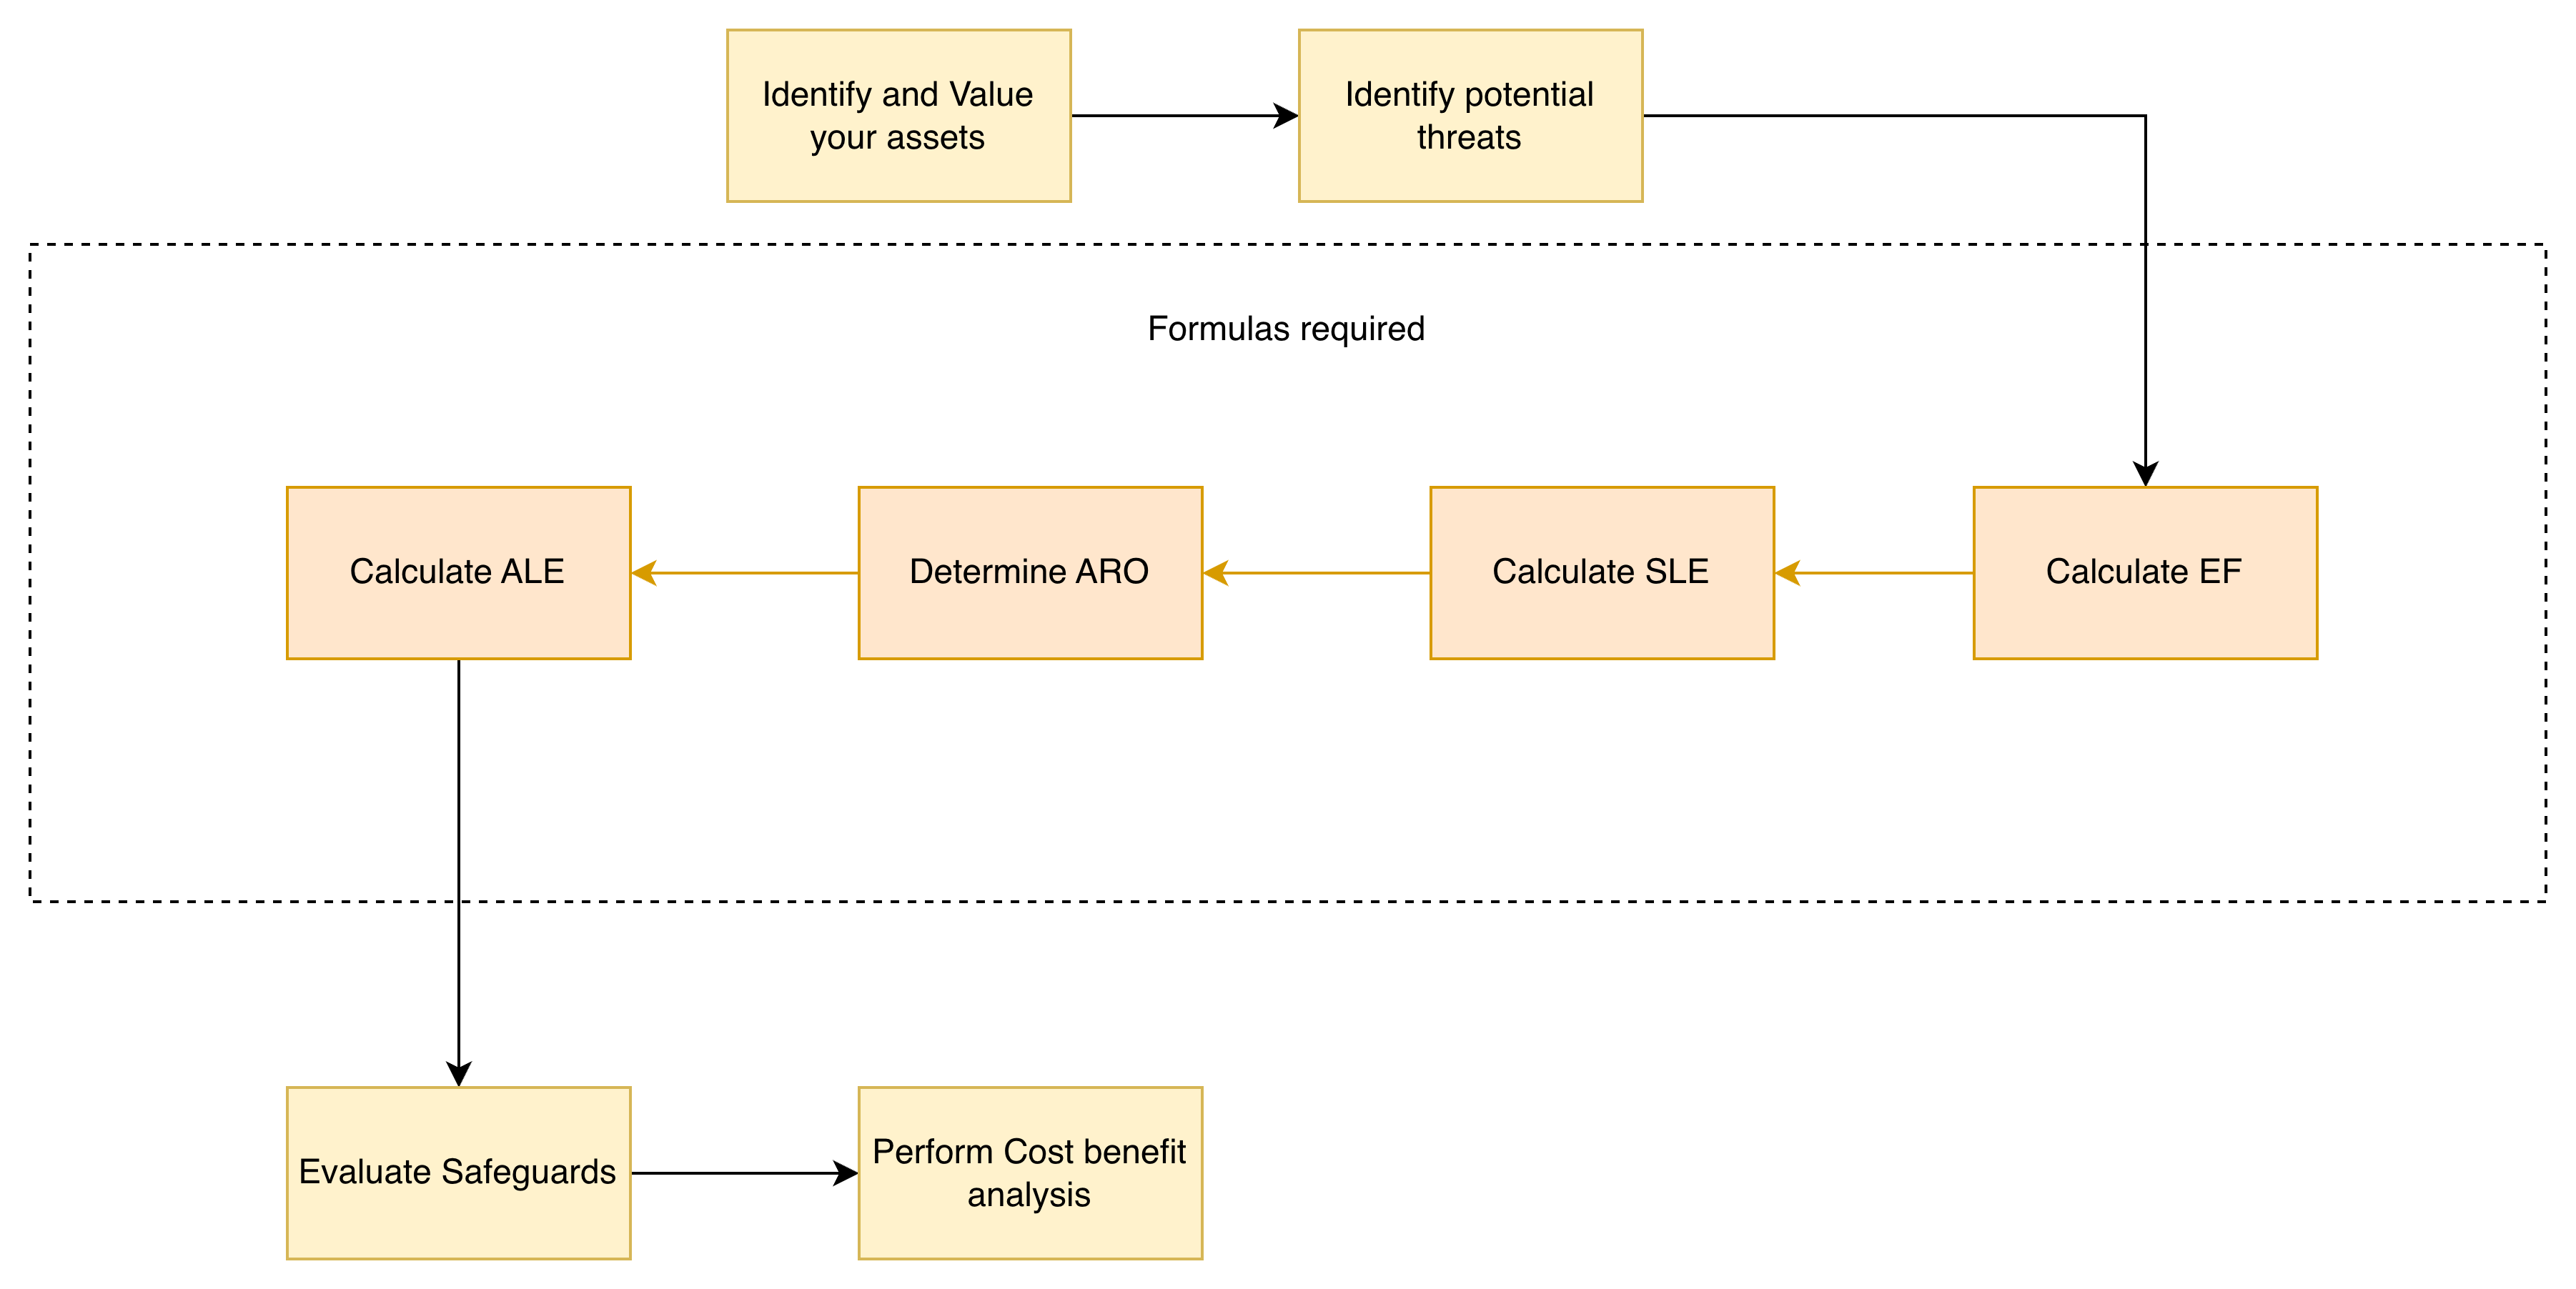
Here’s how quantitative risk analysis works in the real world:
1. Identify and Value Your Assets
List everything worth protecting and assign it a dollar value.
Servers, databases, customer data, and intellectual property. Everything gets its number.
2. Identify Potential Threats
For each asset, list every bad thing that could happen to it.
A database might face threats from ransomware, insider threats, hardware failure, or natural disasters. List them all.
3. Calculate Exposure Factor (EF)
Here’s where it gets interesting.
For each asset-threat pairing, figure out what percentage of the asset’s value you’d lose if that threat happened.
Ransomware might destroy 80% of a database’s value.
A minor breach might only expose 10%.
4. Calculate Single Loss Expectancy (SLE)
Calculate the average amount of financial loss you expect from a single occurrence of a specific threat.
5. Determine Annualized Rate of Occurrence (ARO)
How often will this threat actually happen?
Once a year? Once every five years? This is where historical data and threat intelligence play a crucial role.
6. Calculate Annualized Loss Expectancy (ALE)
This is the number that everyone is interested in. It tells you how much money you expect to lose from a specific threat over a year.
7. Evaluate Safeguards
Research potential solutions and figure out how they’d change your risk numbers.
8. Run Cost-Benefit Analysis
Compare the cost of the solution against the money it saves.
If a $20,000 firewall saves you $80,000 in annual losses, that’s an easy decision.
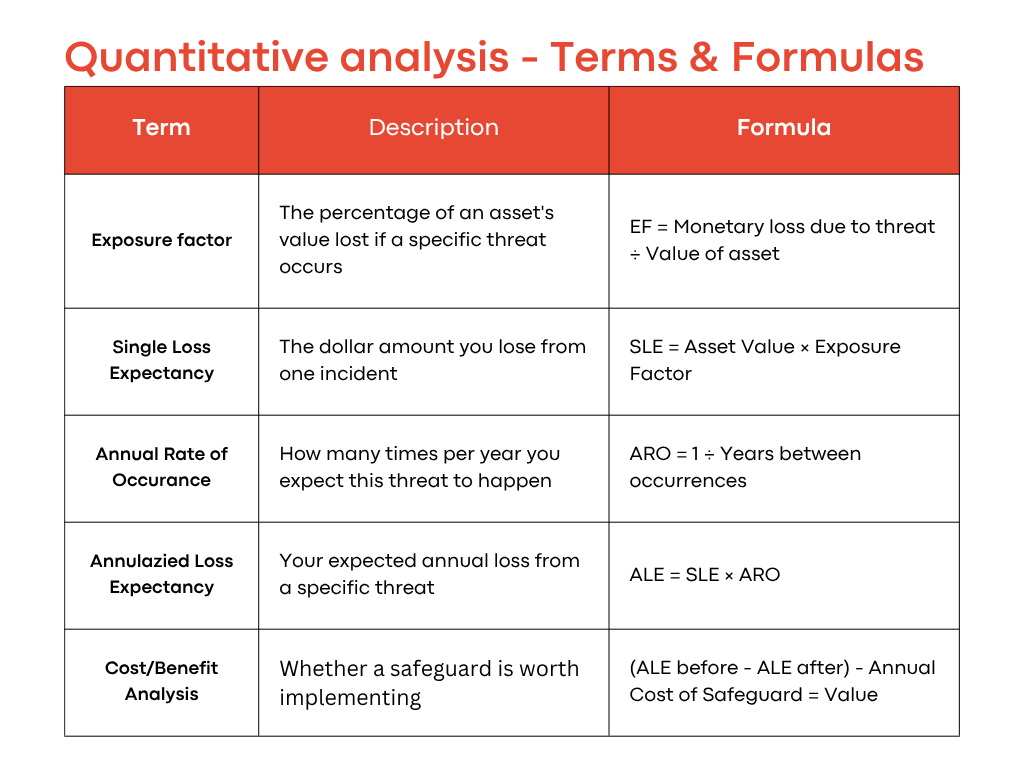
The Formulas you actually need to know
Okay, now you need the process, but that isn’t enough. I’ve used several terms that you need to be familiar with for both the exam and for the real world analysis.
Do you find this article interesting? Great, let me know in the comments! I will be happy to read your feedback!
Exposure Factor (EF)
What it is: The percentage of an asset’s value lost if a specific threat occurs.
Formula: EF = Monetary loss due to threat ÷ Value of asset
Example: A $100,000 server suffers $30,000 in damage from an attack? That’s a 30% exposure factor.
CISSP tip: The exam will give you scenarios where you need to calculate EF from other information. Practice extracting these values from word problems.
Single Loss Expectancy (SLE)
What it is: The dollar amount you lose from one incident.
Formula: SLE = Asset Value × Exposure Factor
Example: $100,000 asset × 30% exposure = $30,000 per incident
This is straightforward multiplication. Don’t overthink it.
Annualized Rate of Occurrence (ARO)
What it is: How many times per year you expect this threat to happen.
Formula: ARO = 1 ÷ Years between occurrences
Examples:
Threat happens once every 5 years? ARO = 0.2
Threat happens twice per year? ARO = 2.0
Threat happens once every 2 years? ARO = 0.5
The exam loves testing this with phrases like “occurs every X years.” Just flip it: 1 ÷ X.
Annualized Loss Expectancy (ALE)
What it is: Your expected annual loss from a specific threat.
Formula: ALE = SLE × ARO
Example: $30,000 SLE × 0.5 ARO = $15,000 per year
This is THE number that matters. This is what you tell executives. This is what justifies your budget.
Cost-Benefit Analysis
What it is: Whether a safeguard is worth implementing.
Formula: (ALE before - ALE after) - Annual Cost of Safeguard = Value
If the result is positive, the safeguard makes financial sense.
If it’s negative, you’re spending more than you’re saving.
Conclusion
If you’ve read this far, congratulations.
You now understand the math that most security professionals never learn properly.
Use it wisely.
Because I find this one of the most important topics in the CISSP materials and in the real world.
Master it, and you’re not just passing an exam.
You’re becoming the kind of security professional who can actually get things done.
Warning: This isn’t the end of the article!
And if you’re interested in the real world scenario that will show you how to use the formulates in practice, just scroll down!
Want the Complete Domain 1 Roadmap?
Quantitative risk analysis is just one piece of Security and Risk Management.
If you want a structured way to master Domain 1, I’ve created something for you.
My CISSP Domain 1 Checklist provides clarity and focus on everything that truly matters for the exam and real-world practice.
➡️ Download it here and stop wasting time on scattered study materials.
A Real Scenario - How to use the formulas properly
Let’s walk through a complete example, exactly like you’d see on the CISSP exam.
The Situation:
Your company has a server storing critical customer data worth $100,000.
Security analysis shows:
20% annual probability of a data breach
A successful breach would compromise 70% of the server’s value
Should you implement a $4,000/year security solution that would cut breach probability in half?
Let’s do the math.
Step 1: Extract What We Know
Asset Value: $100,000
Exposure Factor: 70% (given in scenario)
Breach probability: 20% per year
Step 2: Calculate SLE
SLE = Asset Value × Exposure Factor
SLE = $100,000 × 0.70 = $70,000
That’s the damage from one breach.
Step 3: Calculate ARO
If there’s a 20% chance per year, that means on average one breach every 5 years.
ARO = 1 ÷ 5 = 0.2
Step 4: Calculate Current ALE
ALE = SLE × ARO
ALE = $70,000 × 0.2 = $14,000/year
Without any safeguards, you’re losing an average of $14,000 annually to this threat.
Step 5: Calculate New ALE with Safeguard
The security solution cuts breach probability by 50%, so new ARO = 0.1
New ALE = $70,000 × 0.1 = $7,000/year
Step 6: Run Cost-Benefit Analysis
(Current ALE - New ALE) - Annual Cost of Safeguard
($14,000 - $7,000) - $4,000 = $3,000
Result: Positive $3,000 value
The safeguard saves you $3,000 per year.
Congratulations!
You just finished your first quantitative analysis! Let me know in the comments how it went!
Thank you for supporting Decoded Security!
BONUS: Printable cheatsheet